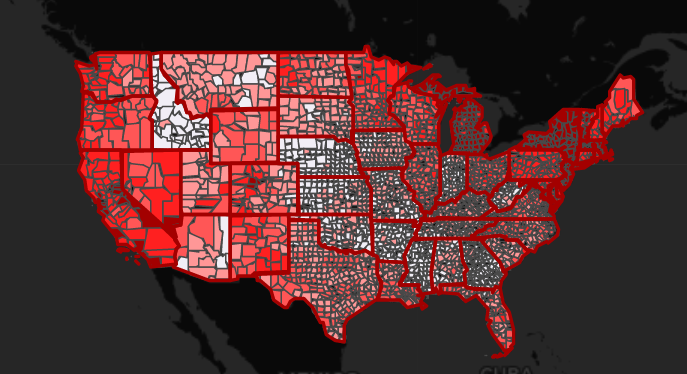
Covid-19: U.S. County Job Loss
Covid-19 has affected everyone in the U.S. This interactive map enables exploration of covid's effect on each county by the total number of low-income jobs lost and its percentage of county employment.
Metadata
GeoJSON and CSV low-income job loss data collected @ Urban Institute Data Catalog
Utilized Javascript's JQuery Library and Leaflet to upload and manipulate geoJSON data
Appalachian Trail Commemorative Map
A Craggy Cartographers' Appalachian Trail map commemorating Erwin Raisz. The map shows the Appalachian Trail within three contiguous states: Pennsylvania, Maryland, and Virginia.
Metadata
Georeferenced tif to 10m graticule.shp overlaying a state.shp
Created in QGIS 3.12.2
Raisz_Landforms1957.tif
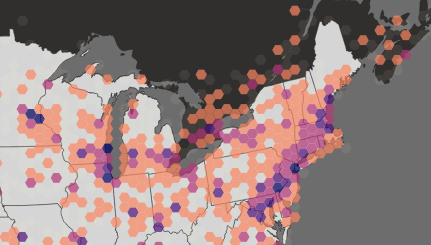
Brewery Density, U.S.
Who doesn't love a good a beer? Well, you be the judge! This map shows the distribution and density of breweries across the nation. Is your home state full of breweries, and coincidentally, tipsy neighbors?
Metadata
Brewery Geopackage downloaded from THe POI Factory
Used QGIS 3.12.2 to create hexbins 50km (long diagonal)
Brewery density in Denver, CO
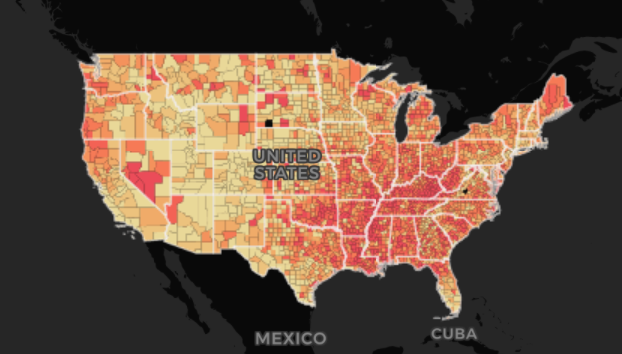
Cancer Death Rate, U.S. (2009-13)
Shows the cancer death rate in the United States. Collected data were organized by SQL querying and later joined (state/county names/FIPS). This map is also hosted by CARTO. Every county helps make up this chloropleth map, and clicking on each county initiates a popup with the county name, its death rate per 100k people, and its state.
Metadata
See at bottom of webpage
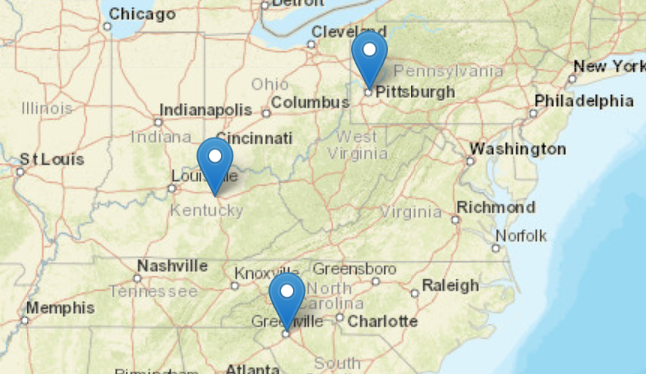
My Favorite Cities
This map represents how Javascript can create markers and tooltips/ popups while using for loops in arrays of data. My three favorite cities are Pittsburgh, Lexington, and Greenville. Pittsburgh is my birthplace and home of the Steelers. Lexington is currently my home, and Greenville is where my sister is.
Metadata
See bottom of webpage

Vacation Wishlist: Prague
Just a simple, yet fun, map/webpage that displays some personal interest of mine. Everyone has a vacation wishlist/bucketlist. I have always wanted to visit Prague ever since I realized just how much cars are associated with it. Find out more why I like Prague so much in the webpage.

Firearm Panic Buying: 2020
Panic buying started to increase admist the spread of Covid-19 and civil unrest, pending the presidential election. Firearms have been no exception: record sales in 2020, over 17 million. Sales data from 2008-2019 is alos provided as reference.
Metadata
FBI NICS CSV
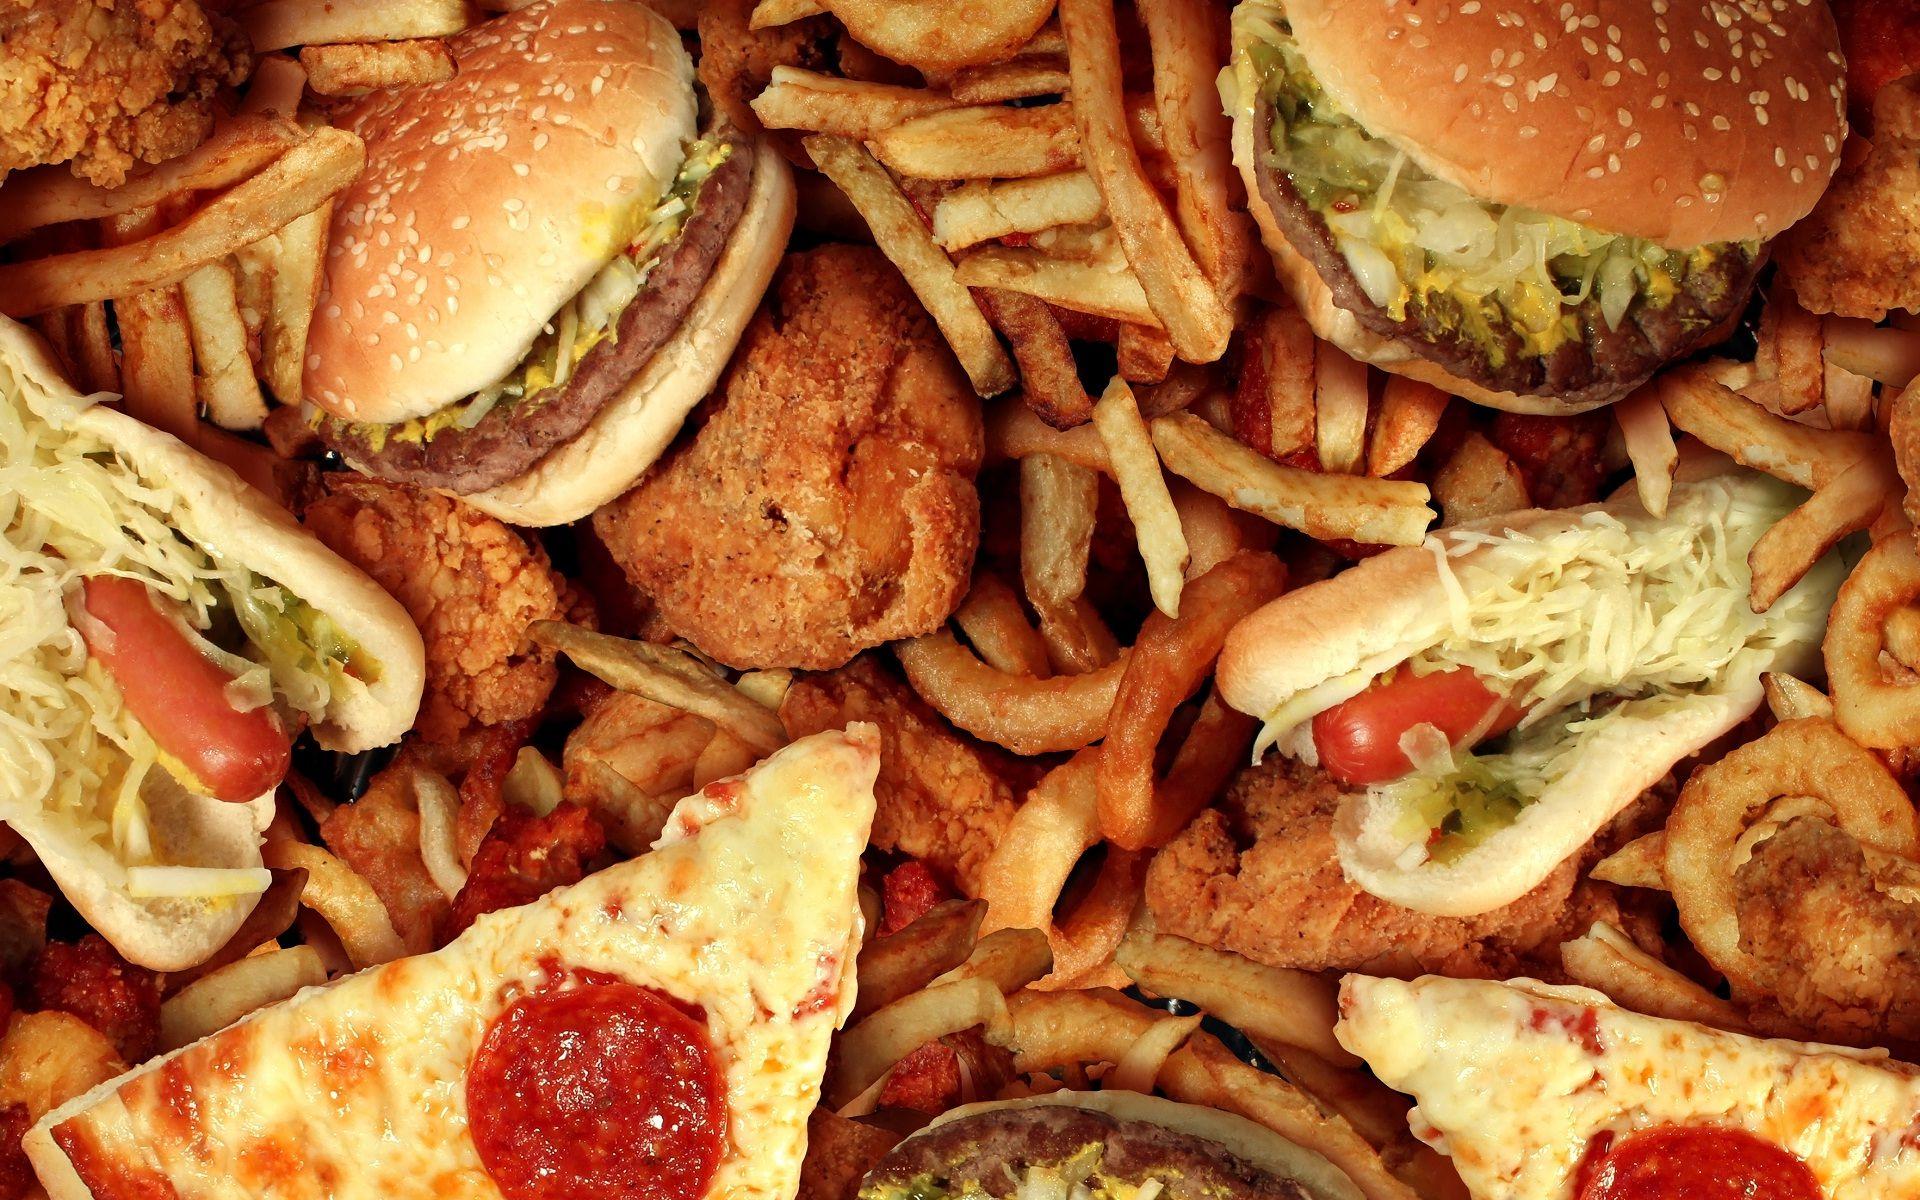
Food Swamps in the U.S.
Food Swamps provide a spatial metaphor for food deserts. Where organic food is scarce, fast food is plentify. This is the current definition of swamps. But is it holistic? It is possible that food swamps exist amidst grocery stores and farmer's markets. But if organic/healthy food is financially inaccessible, fast food is still king in low-income communities.
Metadata
states & urban data
food data
